What does Statistics have to do with Netflix knowing what movies you will like? A lot. Specifically with something called correlation. In Statistics, correlation allows us to measure the degree in which two different phenomena are related to one another. It is certainly possible to find correlations everywhere, for example:
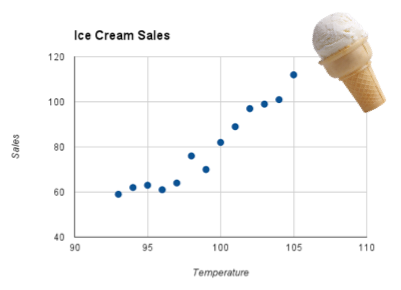
- Temperatures in the summer and sales of ice cream.
- Completed years of education, the higher your potential to earn.
When one of them goes up, so does the other one. These types of relationships, for example the one of the temperature and ice cream sales, can be represented by a graphic called scatter plot, like the one below:
But then, how does Netflix know me so well to know what movies I will like? The answers is that it does not know you but it can predict what you will like through the usage of complex statistics using the data of the films you have liked in the past based on how you —and other customers— have rated them.
Netflix estimates that 75% of user activity is driven by automated recommendations that the service provides to its users. Back in 2006, Netflix launched a contest called Netflix Prize in which any person was invited to came up with a new algorithm that improved the existing Netflix recommendation system by at least 10 percent (that is 10 percent more accurate in predicting how a customer would rate a film after watching it). The individual or team that accomplished this feat would obtain one million dollars.
Using what they called “training data” —more than 100 million ratings given to 18,000 films by 480,000 Netflix customers— thousands of teams from 180 countries developed improvements to the existing algorithm to accurately predict the actual rating these customer will give to a selected group of films. After three years of perfecting the algorithm and thousands of attempts by the participants, Netflix declared a winner: a team of seven people conformed by statisticians and computer scientists from several countries.
What this algorithm does is an automated version of what we have been doing for several years to pick a movie to watch: find somebody with a taste in movies that matches yours and ask for a personalized recommendation, knowing that if that person’s likes and dislikes closely approach yours then that person’s choice will be similar to yours. In Statistics this is called correlation.
We can say that two specific variables are positively correlated if a change in one is directly associated to a change in the other one, always in the same direction, this could be the case for the relationship between height and weight. This is because people who is taller generally weigh more (on average); and people who is shorter tend to weigh less (also, on average).
The reason why I emphasize that these associations are not exact but average is because not every observation fits exactly an specific pattern. In some cases, short people weigh more —much more— than tall people, and in other cases, people who don’t exercise at all are slender than people who frequently exercise.
One interesting characteristic about correlation as a statistical tool is that it is perfectly possible to express an association among two specific variables in a simple but very descriptive statistic called the correlation coefficient, which features two interesting points to notice. Firstly, that coefficient is just a simple number whose range goes from –1 to 1. When a correlation coefficient is 1, also known as perfect correlation, it implies that an alteration in one of the variables is directly linked to an equivalent change in the other variable in the same direction, and when the correlation coefficient is –1, also known as perfect negative correlation, it implies that an alteration in one of the variables is directly linked to an equivalent change in the other variable, but this time, in the opposite direction. When the correlation coefficient gets closer to either 1 or –1, then it is said that the correlation is stronger. Plus, when the correlation coefficient is 0 or close to 0, then it is said that there is no correlation between the two variables, to make this point clear, we can use the example of the —ridiculous and non existent— correlation between the number of shoes a person owns and the weight of that person. Secondly, when the correlation coefficient is expressed no units are involved, no matter what the nature of and how different each of the variables is, such is the case of the correlation between a variable expressed in units (number of shoes) and a variable expressed in kilograms (weight of a person).
Finally, the most important feat that, in Statistics, a correlation coefficient allows us to do is to simplify what could be very complex relationships among tons of pieces of data —which would require several different charts and tables to express— using an extremely simple descriptive statistic, the same one that Netflix uses to give us an extremely accurate recommendation of the next movie we will watch.